By: Aaron Wall, CFA
Partner, Portfolio Manager
The chart below plots future inflation expectations as they stand today, last month and one year ago.
One year ago, the Fed made its first interest rate cut of 0.50%. The Biden administration was still in office and not engaged in the trade policy volatility we are currently experiencing. At the time, inflation was subsiding, and victory appeared to be on the horizon.
Fast forward to today and we can see that expectations have elevated in the short term but are still trending lower over the long term.
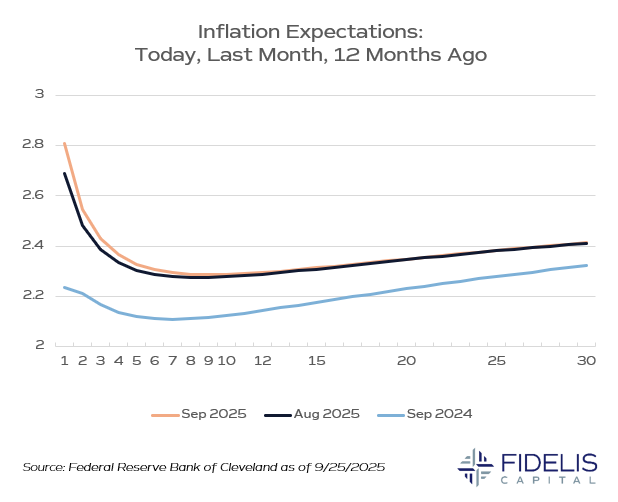
Source: Federal Reserve Bank of Cleveland
This chart is critical for the Fed when it is making policy decisions because it represents one of the most critical battles in the ultimate war against inflation.
When expectations become unanchored, consumer behavior quickly shifts to reflect these expectations, oftentimes creating a self-fulfilling prophecy.
This curve remaining well anchored in the long term is also a signal that the market still believes that the Fed will ultimately guide policy to reach its targets.
As Fed independence becomes a more debated topic, specifically heading into the end of Chair Powell’s term in 2026, we’ll be watching this chart for clues on how the market is grading the Fed.