By: Aaron Wall, CFA
Partner, Portfolio Manager
The consumer has been an important driver of economic activity, serving as a tailwind for the economy through this difficult period. At the end of last year, consumer spending accounted for 68.83% of overall GDP, making it an important economic growth factor.
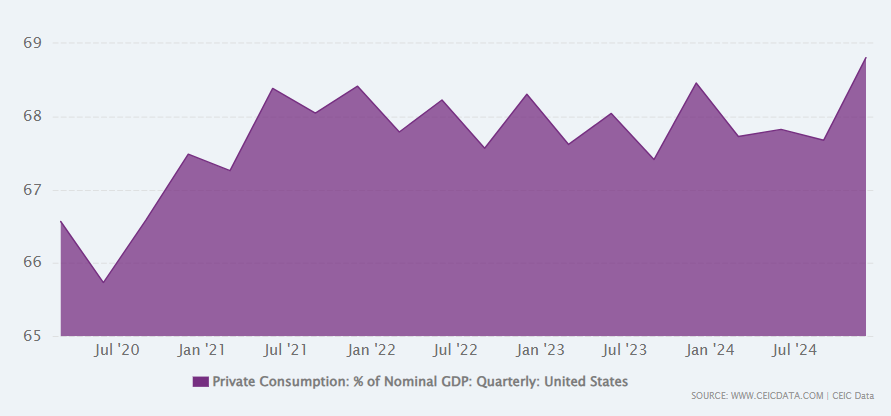
Source: CEIC
Given the importance of this variable, we’ve spent some time looking into the health of the consumer to get a better sense of how sustainable this tailwind truly is. One key metric worth following is household debt to GDP for the US.
When measuring the health of the consumer, it is important to watch debt service. A highly leveraged consumer will be weaker in the face of economic shocks or spikes in interest rates.
The chart below, pulled directly from the Fed’s data, shows the ratio going back 20 years. As you can see, the ratio peaked leading up to the global financial crisis and has been on a steady decline since, probing fresh lows in this year’s releases.
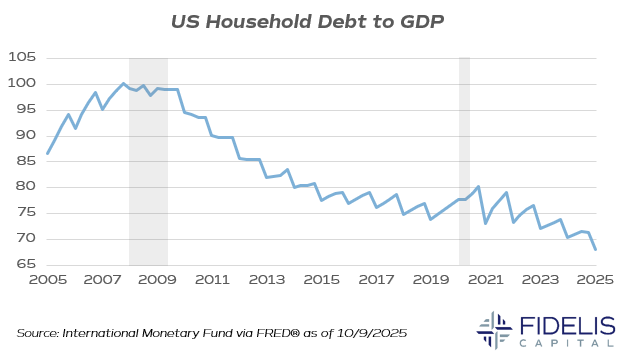
Source: International Monetary Fund via FRED®
Explaining this downtrend can be tricky. A major part of the decline has been the low interest rate regime the US economy was stuck in for a long period after the financial crisis. Now that rates are elevated and more closely in line with long-term averages, it has been important to see this trend continue.
Much more to come as we continue to dive into consumer and corporate balance sheets, but this trend does give greater confidence that the economy is on strong footing.