By: Aaron Wall, CFA
Partner, Portfolio Manager
This week, markets remained relatively calm. Q2 earnings season is nearly over, and as of the end of last week, 88% of S&P 500 companies had reported. 76% of these companies reported a positive revenue surprise, and the earnings growth figures continue to be impressive. Let’s dive into a few charts that have caught our attention.
Broadening Out
One thing we’ve often talked about this year is the equal-weighted S&P 500 versus the traditional market-weighted S&P 500.The market-weighted version is what we are all most familiar with, and it has become much more concentrated across a limited number of names, the Magnificent Seven in particular, over the last few years.
We can see the impact in this first chart, showing the 2023 performance of the equal-weighted S&P 500 (RSP) in light blue versus the market-weighted S&P 500 (SPY) in navy. We see the market-weighted S&P 500 vastly outperformed thanks to a few large companies.
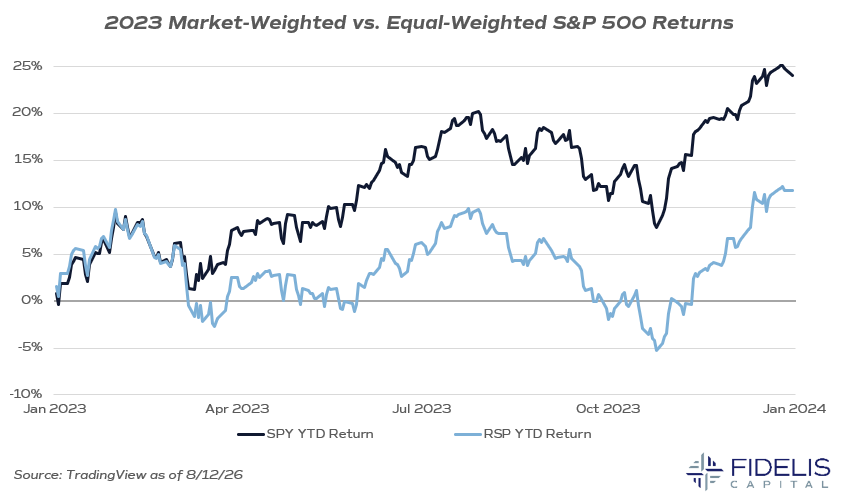
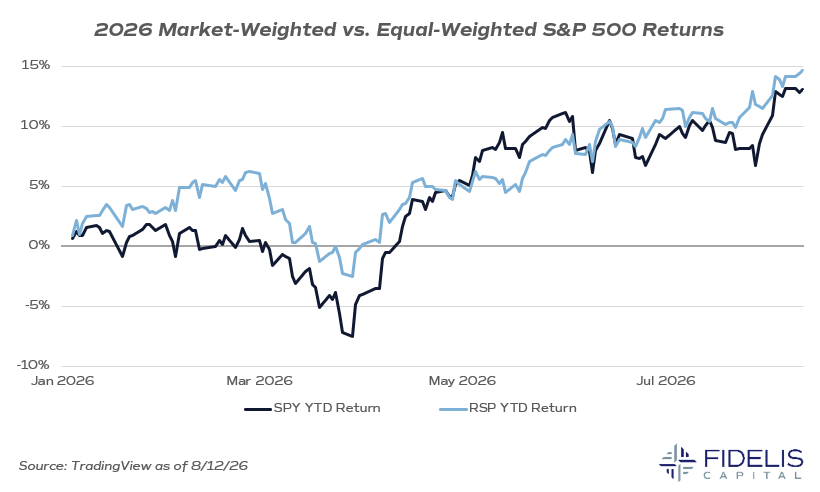
We highlight 2023 as an example because of the clear separation in performance. So far in 2026, highlighted in the next chart, we’re seeing a much closer battle. The equal-weight currently holds a narrow lead.
This is an important metric to continue tracking because it shows that we are now moving into a part of the cycle where participation in the bull market is widening. Although there is still much to monitor with the AI trade, seeing broader participation across the market gives a positive indicator regarding the health of the overall market.
AI Hits Free Cash Flow
Free cash flow is an important financial metric that represents the amount of cash the business generates net of its operating, investing, and financing costs. It varies between industry, but a high free cash flow is generally seen as a strong indicator for the health of a company.When companies have high free cash flow, they have a lot of options on how to use it. For example, they can return more cash to shareholders in the form of dividends/stock buybacks, or they can hoard cash for a rainy day (and earn a healthy yield in this interest rate environment!). Companies can also invest this cash back into the business.
Over the last few years, tech companies have been darlings at generating free cash flow, and a lot of that is because they have historically operated as businesses needing low recurring investment in fixed assets. Put differently, they don’t need to build more factories or acquire more heavy machinery to increase their output.
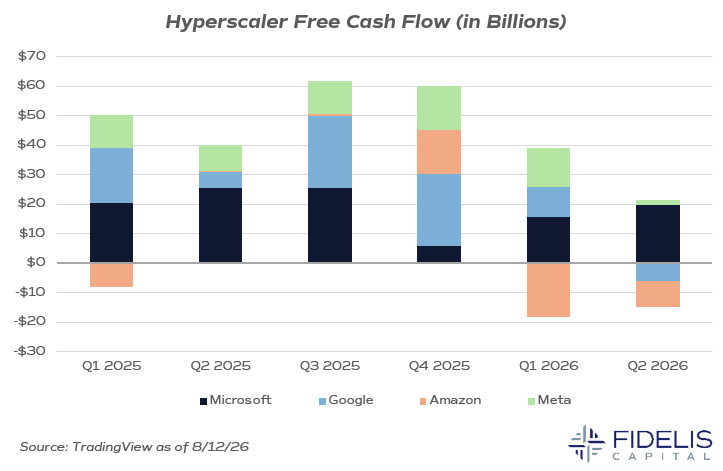
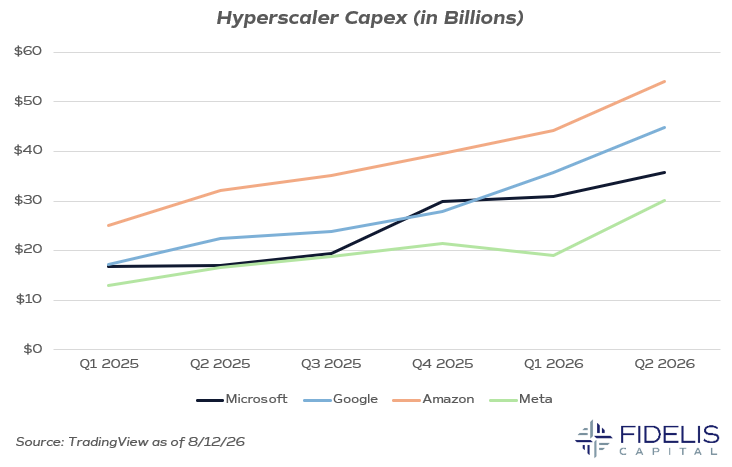
In the AI world, however, this is changing. If we focus on the top four hyperscalers—Google, Amazon, Microsoft, and Meta—we see a changing story. This first chart shows the hyperscaler FCF for the last six quarters. The second chart shows hyperscaler capex over the same six quarters. We can see that capex is moving higher and FCF is moving lower.
So far, this paints the picture that the boom in AI capex has largely been funded out of free cash flow, much more tolerable over the long term than debt financing. At the same time, FCF is starting to run out.
The scale of investment is massive, but what really matters is the duration of these capex investments. If they can boost earnings quickly, then these investments will look like home runs and should serve as a long-term benefit to earnings. If they take longer to recoup their cost, it could be a different story.
We are still in the early innings of this boom, but these are the types of financial metrics that will be important to track over the next few quarters.
Debt Markets Also Contributing to FCF
Not everyone is a hyperscaler with buckets of free cash flow, and hyperscalers may not ultimately want to use up all their free cash flow just investing in AI.According to Bank of America Global Research, $344 billion in AI-related debt has hit the market through August of this year. There is no reason to expect that pace will let up through the end of 2026. The chart below from J.P. Morgan Asset Management highlights how hyperscaler debt issuance has grown since 2021.
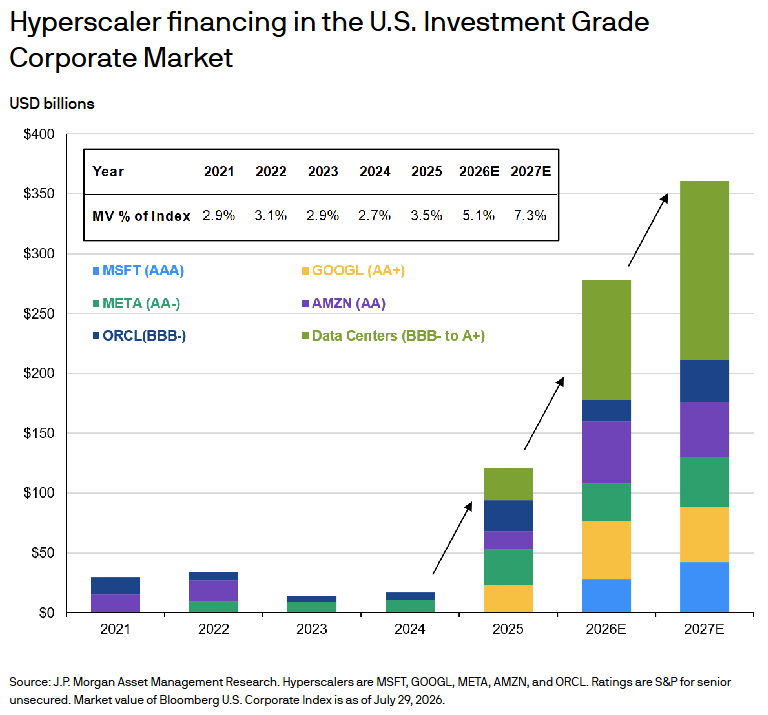
Source: J.P. Morgan Asset Management
With this large issuance, we have seen credit spreads start to widen, but a lot still depends on the individual credit themselves. That is, we’re not seeing a market shift, but some companies are starting to flash yellow. We’re also seeing an increase in “creative” financing to feed the AI spending beast.
Just this week, Nvidia announced a $500-billion plan to help companies that are building out AI finance the chips needed to operate the data centers. This plan envisions investors contributing to a Special Purpose Vehicle (SPV) that uses the cash proceeds to purchase chips. Then, the SPV leases the chips out to a customer. The investors earn a yield, similar to a traditional asset-backed security.
Nvidia is also in talks to provide a backstop to these vehicles because the main concern for investors is that the chips they purchase become obsolete as semiconductor technology continues to advance.
The chips are the true asset (or collateral, in a way) that need to maintain value in order to protect the principal investment. This structure is innovative (read: complex) but is not unsurprising given the insatiable demand for capital to invest in AI and data center capacity. The consortium of financiers alongside Nvidia are the larger private investment firms that you might imagine.
Keeping track of these newer financing vehicles and their performance will be important as the web of AI investment continues to grow.