By: Aaron Wall, CFA
Partner, Portfolio Manager
Markets reacted swiftly at Monday’s open to factor in the Iranian military operation that began last Saturday. In this week’s edition, we’ll analyze some of the key indicators we’ve been following to understand the market reaction to these events.
Before we dive in, keep in mind that your Fidelis team is here. Please reach out to us if you’d like to discuss any of the recent developments.
Key Indicator #1: Energy Prices
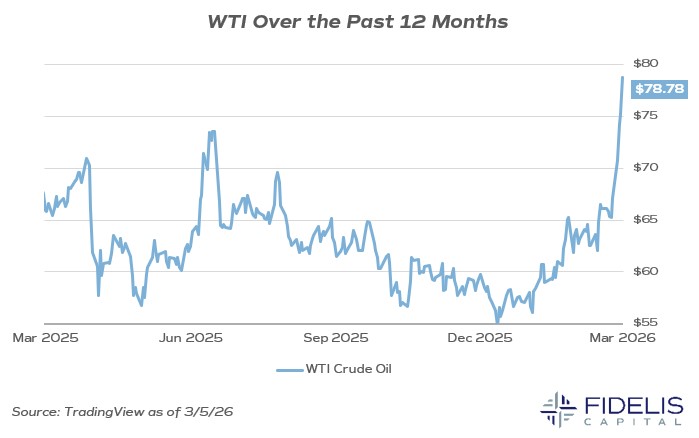
In previous Insights, we’ve pointed out that oil prices have been sticky through recent geopolitical events.Revisiting the West Texas Intermediate (WTI) benchmark, we can see that oil prices spiked last June in reaction to the first Iran incursion but spent most of the year in a downtrend.
Since the beginning of 2026, however, oil prices began moving to the upside, largely a reflection of markets pricing in US military action in Iran. This was directly tied to the shift of resources into the region leading up to Saturday’s strikes.
Unsurprisingly, oil prices skyrocketed this week. The shock to the upside has been violent, but so far, it has been more contained than most people would have expected.
Dan Clifton of Strategas Research notes that previously, $80 a barrel (near the current price at time of writing) has historically been when the US started drawing from the strategic petroleum reserve. Adjusting for inflation, however, the equivalent price in today’s dollars would be $110.
We’re watching the following chart closely, as a longer conflict that leads to higher-for-longer oil prices will be challenging to reconcile when it comes to inflation.
Energy prices are highly sensitive. Sustained, higher oil prices will show up quickly and move inflation in the wrong direction. We expect oil prices to be a strong gauge of how the market is viewing the potential for escalation or de-escalation.
Key Indicator #2: Equity Benchmark Performance
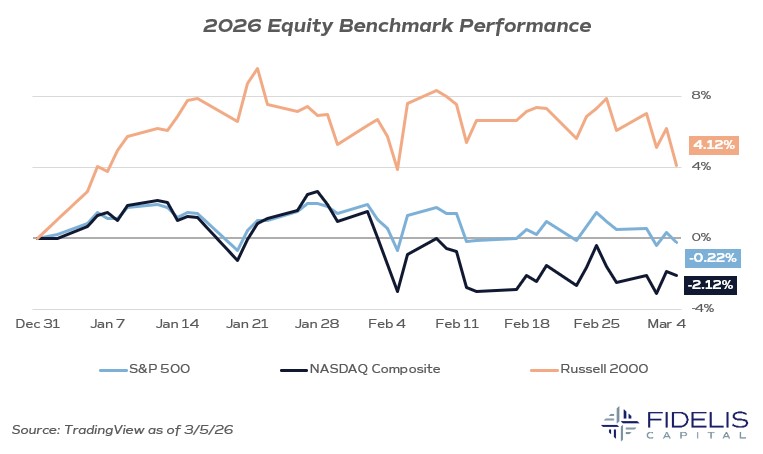
Moving over to the US equity market, stocks have held up relatively well this week given the overall news. Equities are on track to close lower for the week, but it bears repeating that the market’s performance so far this year feels a lot more significant than it has been.The S&P 500 and Nasdaq are both down less than 2.5% on the year as of Thursday’s close, and small-cap stocks remain positive. Given the inherent uncertainty that military operations bring, it’s important to understand that more volatility is likely ahead. For now, however, the equity market activity for the year has been relatively tame.
Key Indicator #3: Volatility
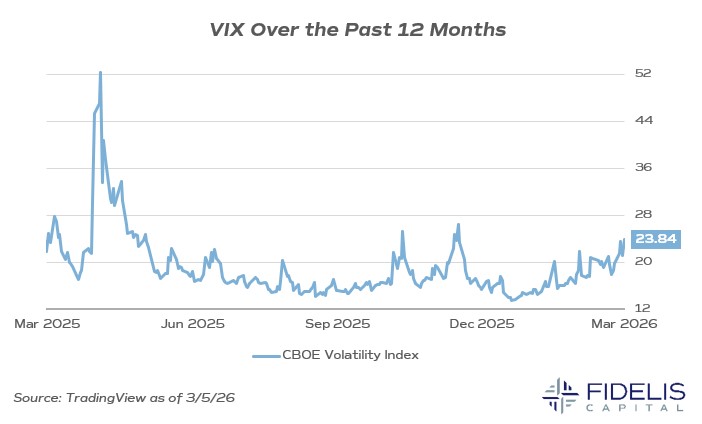
Speaking of volatility, the Volatility Index (VIX) has also remained relatively in check. Looking back at the last 12 months, the chart below shows that the VIX reached highs just over 50 during the aftermath of Liberation Day last April.Even with all the geopolitical events so far this year, the VIX is currently trading at less than half of that level. As the VIX moves over 20, it’s important to understand that days like we’ve had this week—with wider troughs and peaks—will be more standard.
At a VIX of 24 (near current levels), the market is implying daily moves of around 1.5%. This means the market is certainly pricing in wider swings than we’ve had recently but far from the jarring levels of volatility that we traditionally experience during events like Liberation Day. We are paying close attention to VIX levels as a signal for general market sentiment.
Key Indicator #4: Flight to Quality
During times of panic, a “flight to quality” is a common reaction for global investors. When trying to gauge whether the market is fully embracing a risk-off mantra, tracking these assets is useful.The dollar, after weakening for the better part of last year, has displayed meaningful strength this week. This is in line with a flight-to-quality sentiment.
On the other hand, gold prices fell this week and yields rose. Gold has enjoyed a nice rally to start the year, likely a result of investors getting ahead of the volatility. The 10-year Treasury finished last week 0.19% lower than Thursday’s close, likely reflecting the potential impact higher energy prices may have on future Fed decision-making.
Seeing just one of these indicators signal a flight to quality underscores that market volatility is rising, but the market is still far from displaying traditional signs of panic.