By: Aaron Wall, CFA
Partner, Portfolio Manager
Markets continue to be sensitive to developments in the war with Iran, headlined by volatile market conditions throughout the week after news of possible peace plan negotiations.
As we’ve alluded to in previous editions, we expect this volatility to be a rain cloud over the market for the duration of the conflict and we continue to emphasize a measured, long-term approach to the market.
With that in mind, we’re zooming out on the economy to re-emphasize several key themes we’re watching in 2026 and how they are affected by the current geopolitical conditions.
Oil Prices In Context
Oil is a key economic input with a wide range of impacts on inflation, which we’ll discuss below. Before diving in, however, it’s important to compare today’s oil prices to those of prior periods.From 2010 to 2014, oil prices traded in a general range of roughly $80 to $100, and it was not uncommon for oil to be above $100. After that period, oil never went above $100 until Russia invaded Ukraine in 2022, then again periodically during the current Iran war.
One important question: Is $100 today comparable to $100 in 2010? If we’re solely looking through the lens of how the higher price will impact consumers, this is an important frame of reference.
According to the Consumer Price Index (CPI) Inflation Calculator from the Bureau of Labor Statistics, $100 in January of 2010 holds the same buying power as $150.81 in February of 2026.
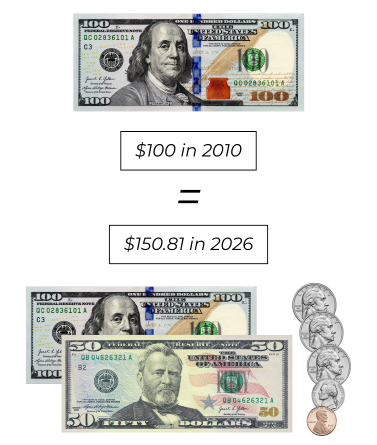
How do we interpret this? Adjusted for inflation, the price swings right now are not at the same level seen during previous cycles of volatile oil prices. Due to inflation, $100 of oil today is a far more tolerable price level than it was in 2010. Oil prices would need to move approximately $50 higher to reach the same inflation-adjusted levels we’ve seen in the past.
Recent Precedent: Inflation During COVID-19
In the famous words of Nobel Prize-winning economist Milton Friedman, “Inflation is always and everywhere a monetary phenomenon.”After hiding in the background for much of the sluggish 2008 financial crisis recovery, inflation kicked back up meaningfully in the post-COVID economic environment.
The policy response created the perfect set-up. Significant fiscal stimulus from policymakers created a significant increase in money supply. Wartime-level spending worked as designed, spreading quickly through the economy and, in some cases, flowing right to consumers in the form of stimulus checks.
A separate policy response, the shutdown of society to combat COVID, meant that consumers were receiving stimulus but limited in their ability to spend it. This led to a significant supply shock, as consumers were flush with cash and willing to pay higher prices for goods that were in a more limited supply.
The result? Inflation rose meaningfully in a short period of time and became the boogeyman that we are still working to contain today.
Oil’s Impact on Inflation
In the traditional CPI, motor fuel makes up 2.981% of the overall basket. This is where the immediate impact of higher oil prices will impact upcoming inflation numbers because it represents a near-immediate pass-through.It’s also important to keep in mind, however, that oil is a critical input to the overall economy. The longer that prices remain elevated, the more impactful the higher prices will be to the broader economy.
For example, higher oil prices can intuitively lead to higher shipping costs and higher airline ticket prices. If businesses expect higher oil prices in the future, they have to raise prices to account for this change.
This shift in long-term expectations can be a big driver for persistent inflation and is exactly why the economic narrative remains centered on the duration of the current upswing in oil prices.
We know that CPI is going to be volatile over the next few months to adjust for the immediate price swings, but the question that policymakers will have to wrangle with is: Should these price swings be viewed as noise or as a signal that monetary policy needs to remain tight (or tighten further) in response?
The long-term trend is easily tracked by the Cleveland Fed’s Expected Inflation Term Structure chart.
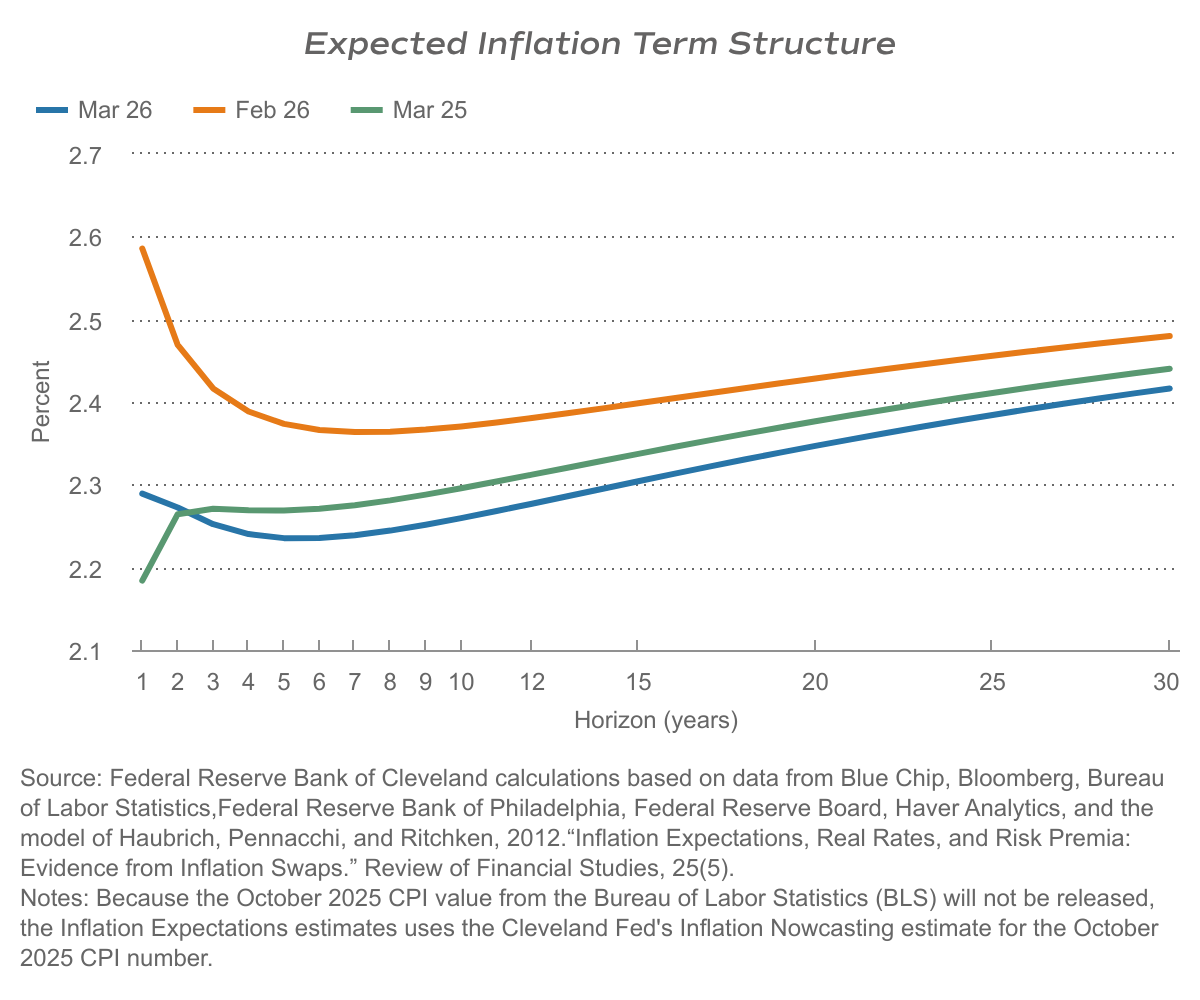
The blue line in the chart above shows the structure as of March 2026. Noticeably, it takes a much different shape than the line from one year ago (green).
Expectations continue to signal a short-term pop in inflation that will move lower towards the Fed’s target level over the next few years. Last year, this line signaled that the market was forecasting inflation to move higher in the short term.
How might we interpret this more broadly? One can argue that the current market is less concerned about a sustained reacceleration in inflation and more concerned about slowing growth.
This will be a critical chart to watch over the next few months because a sudden uptick in long-term expectations will no doubt have an impact on the Fed’s interest rate outlook.
Join Us On Substack
Substack is our new hub for Investment Insights where you can easily read previous editions, all in one place.If you are familiar with Substack and prefer to receive in-app mobile notifications and emails when the latest edition is published, please “Subscribe” here.
If you enjoy reading Insights on a computer or tablet, we recommend bookmarking our Substack website for an easier, more convenient experience. No more email searching required. All editions are available on the website.
We’re here to help with any questions you may have!