How Does the BLS Collect and Report Monthly Employment Data?
Aggregating and creating data sets for the entire U.S. economy is an overwhelmingly difficult task. These data sets carry enormous weight, whether you are a retail investor looking to put money to work in your 401(k) or a policymaker at the Fed trying to look for insights to guide your future policy decision making.For unemployment, the BLS uses a survey to gather information on business employment decisions. This is certainly an imperfect way to measure, but there are not many options available to statisticians when trying to assess such a large sample for key statistics such as the unemployment rate. The survey has been refined over the years, so what has caused the recent volatility within the statistics?
We can cite two key challenges that make the process difficult for the BLS. First, the response rate to surveys has fallen since Covid-19. The chart below shows that the overall response rate declined from 60% pre-pandemic to just 43% today.
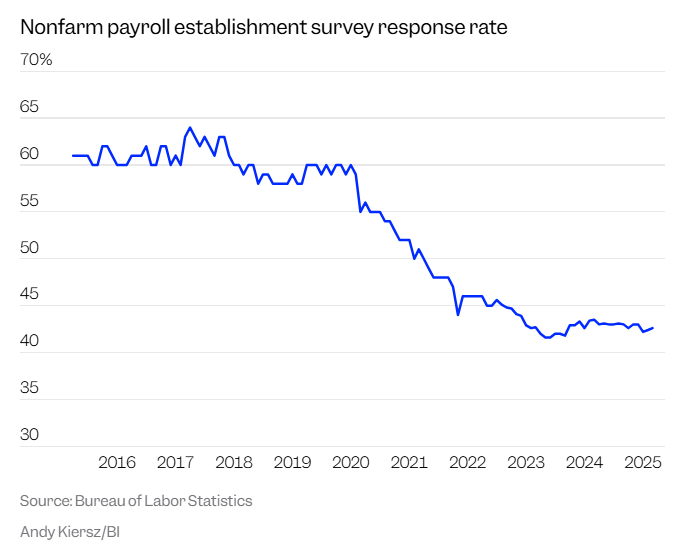
Source: Business Insider
The expected error within any month’s number is also plus or minus 136,000, further highlighting the statistical challenges of reporting these metrics. This large error figure also underscores why we need to take month-to-month reporting with a grain of salt.
As we all know, less data makes for more unstable takeaways. Many businesses do not respond every month, so when they do respond, their findings need to be incorporated—even if they are responding for the previous month. This is what leads to revisions, and it’s a challenge that is not easily resolved.
The second key challenge is funding. Andy Kiersz, writing for Business Insider, observes that, “Adjusting for inflation using the CPI, the 2024 [BLS] budget was down about 4% from the 2015 level.” The 2026 budget also features an 8% reduction in BLS staff.
Conclusion
Gathering these statistics will always be an imperfect science. Chronic underinvestment, paired with a lack of available data, should lead to expectations of volatility within the data. Those that follow this data have been aware of these imperfections.This is why it is important, as we continue to stress with all economic “hard” data, to understand that the data is trying to measure a moving target. Over longer periods of time, this data is valuable and tends to paint a clear picture, but it is impractical to put too much weight on any one report in the moments immediately following its release.
Final Thought: The Wavering Metric Not Included in Soft or Hard Data
An often overlooked, or taken for granted, component of the U.S. economy is trust. Whether it’s the composition of individual data reports or monetary policy decisions from the Fed, trust that this information is non-partisan and has the whole economy in mind is a critical input.It’s hard to measure, but some component of the interest rate differential between a U.S. Treasury and an emerging market bond is because investors have a deeper trust in the U.S. Firing the BLS commissioner because of a lackluster jobs report does not help maintain this trust.
The independence of the Federal Reserve will continue to be an important topic as we approach the end of Powell’s term, and it is hard to understate the importance of the markets’ trust in the Fed. A difficult dance is approaching in September—the Fed now has a stronger rationale to resume cutting interest rates. If it decides to cut, communicating the “why” to markets will be critical.
For those that follow the central bank closely, it should be an interesting few weeks ahead, and we look forward to sharing our thoughts as events continue to unfold.