International Stocks: Hot Start to 2025
Non-U.S. stock markets have led the way to start 2025. The MSCI EAFE, a commonly referenced index that tracks the performance of international stocks in developed countries, outperformed the S&P 500 by over 15% through the end of May. The divergence began when the initial tariff threats on Mexico and Canada were announced shortly after President Trump’s inauguration.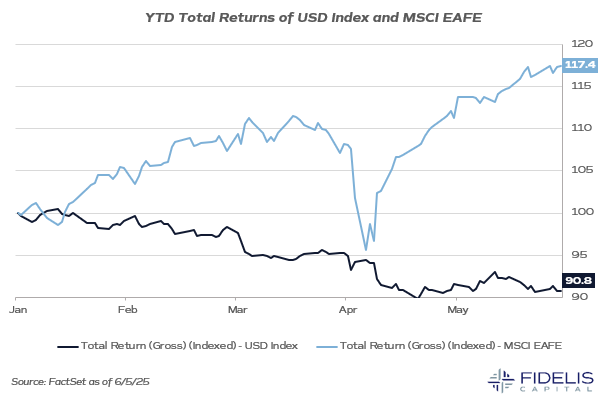
The chart above shows the MSCI EAFE’s YTD return [light blue line] against the performance of the U.S. Dollar Index (DXY) [navy line]. DXY is a measure of the USD exchange rate against the euro, yen, pound, Canadian dollar, Swedish krona and Swiss franc.
Exchange rates are complex and unique to the two countries being paired, but this index serves as a good proxy to understand the USD’s position across the developed world. When the DXY is falling, it takes more dollars to purchase the same amount of foreign currency.
This chart shows a clear relationship between the weakening of the USD and the strengthening of equities across international markets. Since the USD remains the most critical currency in global trade, non-U.S. economies get a boost when their currency can be used to acquire more dollars.
Another key catalyst for European equities has been the ongoing response to Russia’s invasion of Ukraine. Germany, for example, has become more willing to entertain running a budget deficit (akin to spending more money in its local economy) in order to raise defense spending.
As the Trump administration draws suspicion around its long-term commitments to NATO, European countries like Germany are responding by becoming more aggressive in their use of fiscal policy to spend for defense. This additional government spending is seen as a positive for eurozone stocks and certainly has contributed to their outperformance this year.
With trade policy continuing to dominate the headlines, DXY should remain a key focus when looking outside the U.S. The trend of added fiscal policy is also worth monitoring, as additional government spending in the eurozone could be a catalyst to increasing economic growth that has been stagnant for some time. Given these developments, is the story finally shifting for international equities?
Zooming Out: Historical Performance of U.S. vs. International
It’s hard to dismiss the strength in international markets so far this year, but when we look at the bigger picture, it’s equally important to acknowledge the phenomenal strength of the U.S. market. When evaluating long-term returns, the S&P 500 has outperformed the MSCI EAFE over the last 12 months, 3 years, 5 years, 7 years and 10 years. In fact, the S&P 500 outperformed the MSCI EAFE by 3.75% per year over the last 10 years. A key reason for this strength? The U.S. tech sector.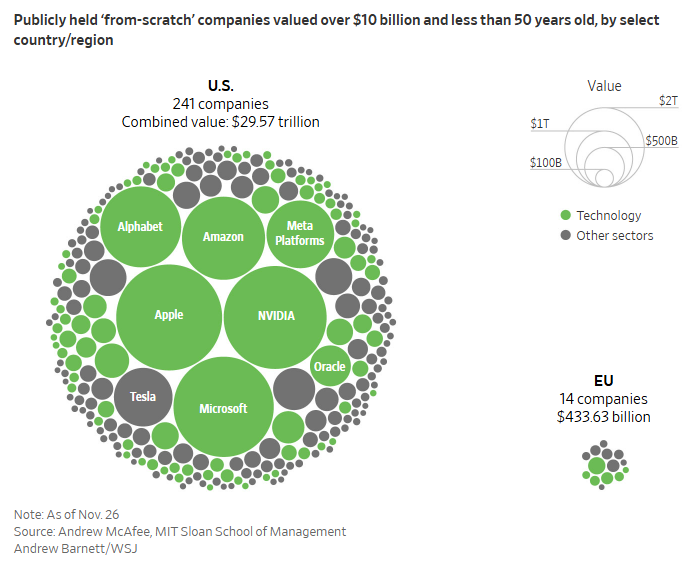
This chart from The Wall Street Journal highlights the difference. In the U.S., there have been 241 publicly traded companies that were founded in the last 50 years and are currently valued over $10bn. The E.U. has only 14. If we look at privately held companies, the U.S. has 690 companies valued at over $1bn, while the E.U. only has 107.
Productivity gains generated from innovation are critical for economic growth, which also directly supports higher stock market prices. It’s not a surprise that markets are putting a premium on the country that is driving new technological innovation.
This also feeds directly into profits. Our partners Rochester Cahan and Tyler Albrecht at Empirical Research Partners point out that, “In aggregate, U.S. stocks are generating an ROE just short of 19% and pay out 72% of earnings via dividends and net buybacks. In other words, investors are pocketing 14% of the equity base every year. In Europe, that number is 9%, and in Japan, it’s 5%.”
As investors search for growth, technology-related themes like AI should remain a key driver. Empirical demonstrates in its research that 45% of the U.S. stock market is comprised of sectors in the highest quintile of AI use. For free cash flow, 61% comes from the top two quintiles of AI use in the U.S.