
Partner, Head of Fixed Income
The recent rally in the Treasury market has been ferocious, with the Bloomberg Treasury Index’s total return up an impressive 7.07%1 from the latest peak in yields on October 19. Other bond sectors have rallied as well, including the municipal bond market, which was up an amazing 8.40%2 over the same period. The municipal market rally has been driven not only by the decline in overall bond market yields, but also by a phenomenon called the “January Effect.”
The January Effect is a seasonal oddity in the municipal market that is characterized by strong demand and a lack of supply. This typically results in municipal bonds becoming expensive relative to their taxable counterparts. While it usually occurs in January, this effect has started as early as November or December in recent years. This year, the combination of the January Effect and investor FOMO has intensified the municipal bond rally, so much so that by some measures, the municipal bond market is as rich as it has been in recent memory. The chart below shows the ratio of the yield on an average 10-year, AAA-rated municipal bond to that of the yield on the 10-year Treasury. The lower the ratio, the more expensive municipal bonds are relative to Treasury bonds.
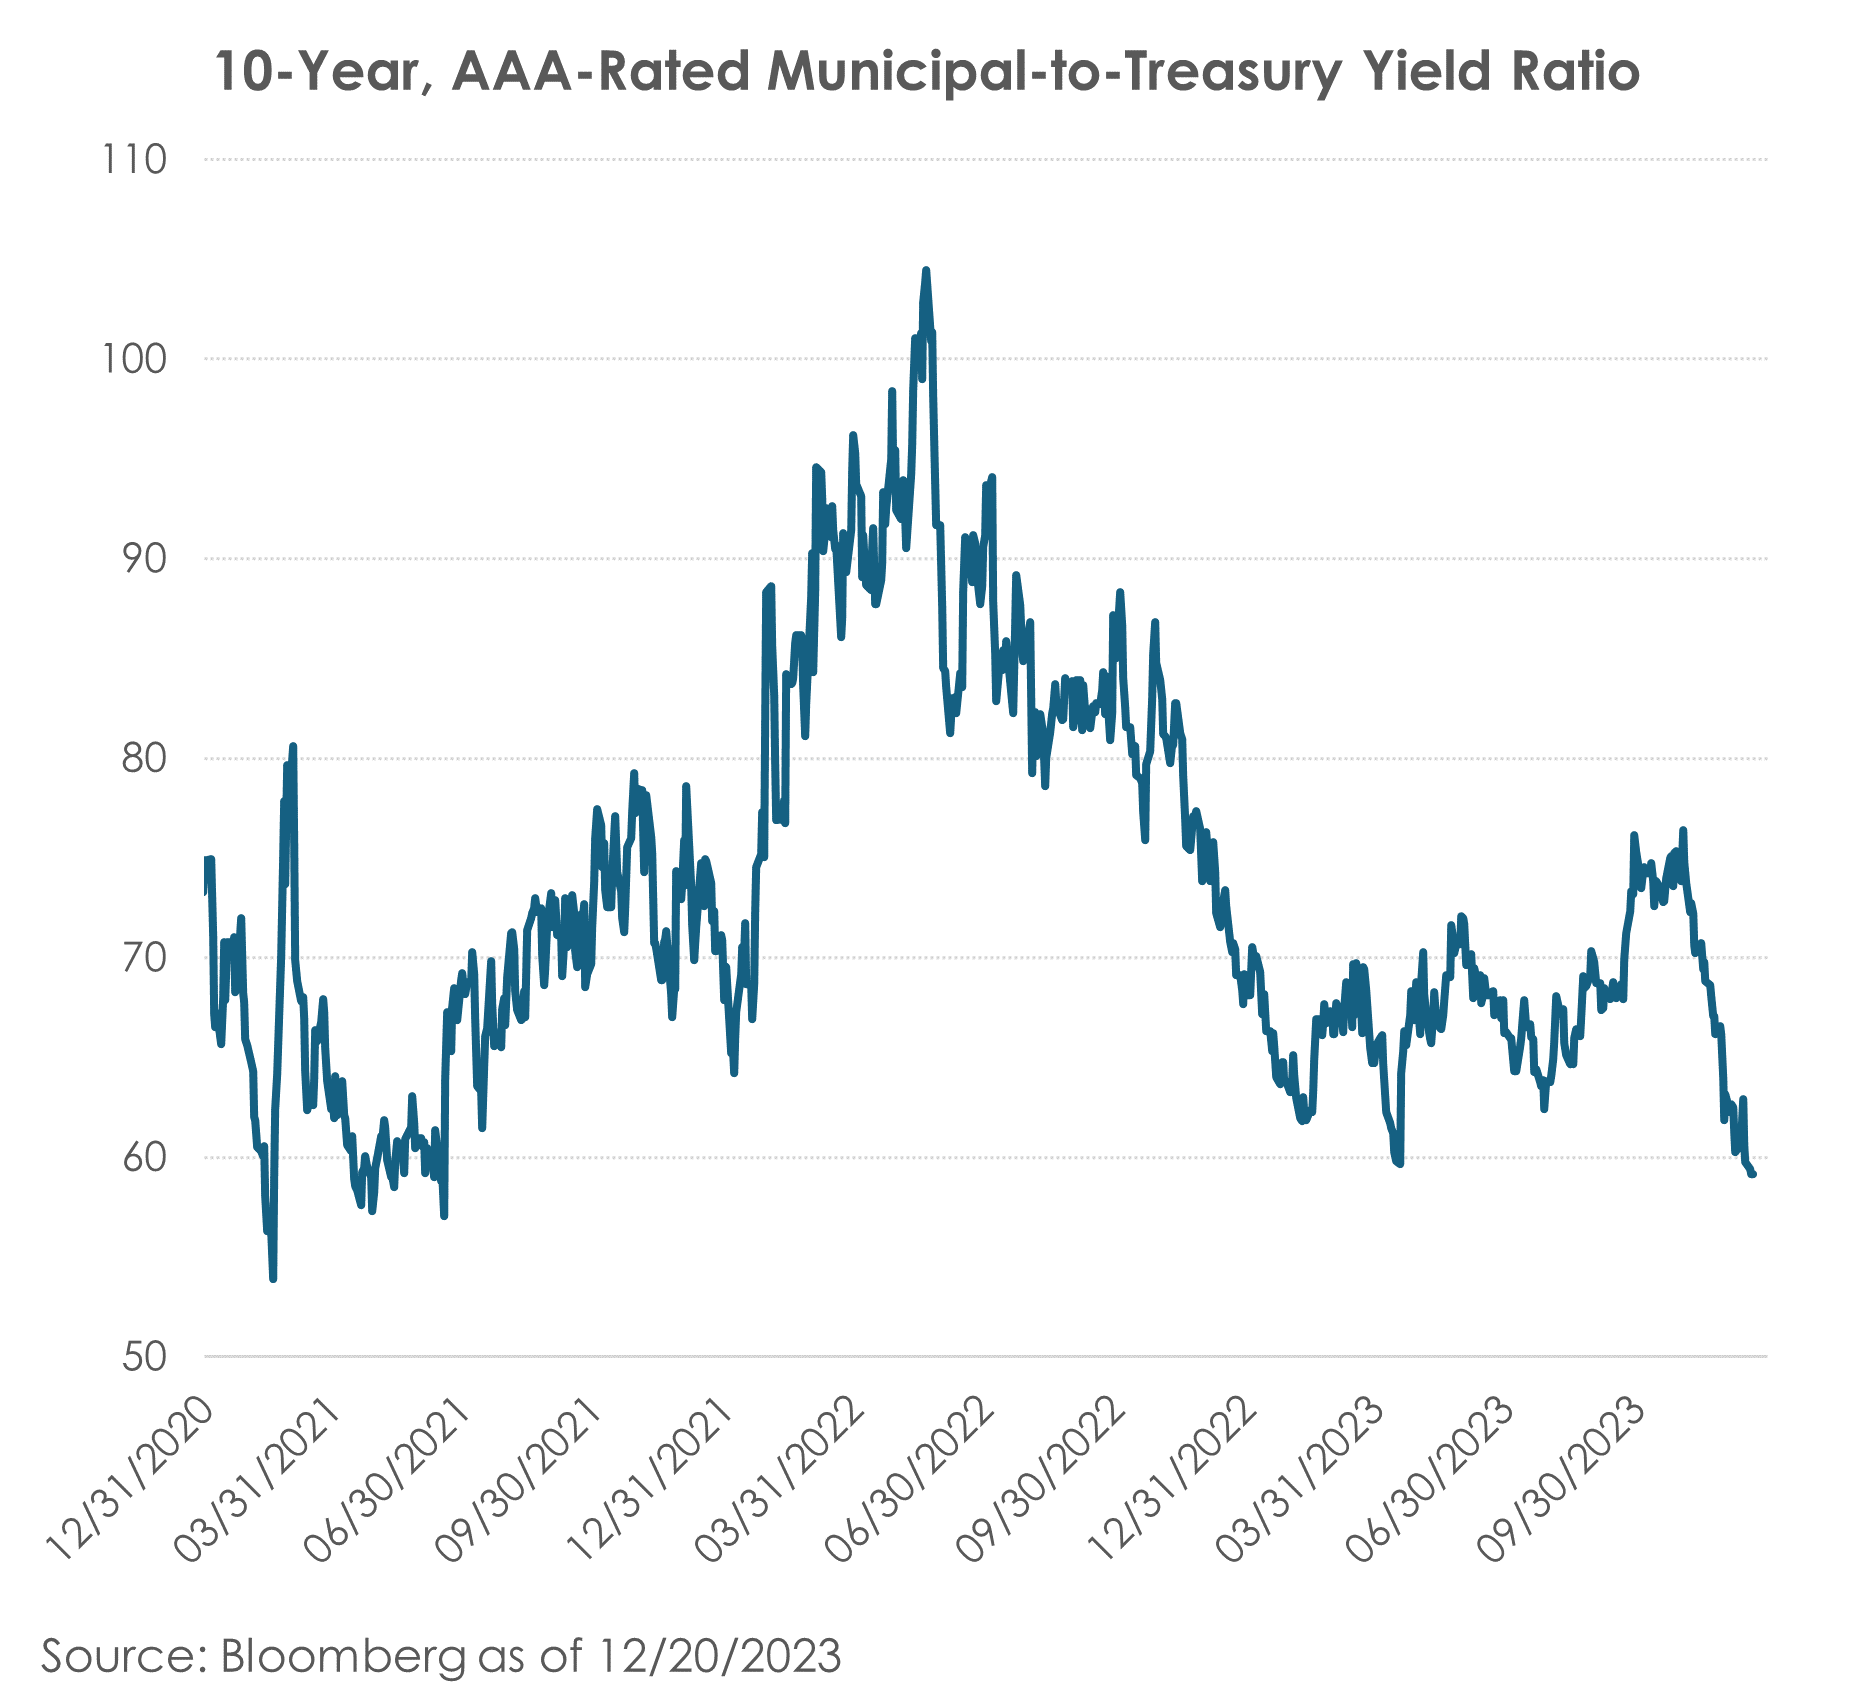
Most recently, this ratio broke through 60% to 59.14%3, a low not seen since the second quarter of 2021. Theoretically, investors subject to the highest marginal tax rate of 40.8% (37% Federal plus 3.8% Medicare surcharge) should prefer Treasuries if this ratio drops below 59.2% as the after-tax income from a Treasury would be higher than that of a municipal bond.4 We should acknowledge that not all AAA-rated municipal bonds are below the 60% ratio and that there are lower-rated municipal bonds that still make sense on an after-tax basis compared to Treasury bonds. That said, this indicator is a good measure of relative bond market valuations and should encourage investors to look at other available fixed-income assets. In fact, if high marginal tax bracket investors were to expand their universe of available bonds to include taxable bonds, they would find opportunities that yield more than comparable municipal bonds on an after-tax basis. Comparison of similar bonds on an after-tax basis is the appropriate analysis to find value across fixed-income sectors.
We believe municipal bonds could continue to remain overbought throughout the next few months as the January Effect continues to run its course. Municipal bond issuance is expected to decline in January and February, yet investor demand for bonds should remain solid. This could move Muni-to-Treasury ratios even lower from current tight levels. There is precedence for such a move—in 2021, the 10-year, AAA-rated Muni-to-Treasury ratio declined to 53% before rebounding.5 If this happens, traditional municipal bond investors should take heed and look for opportunities elsewhere. Sometimes it’s okay to pay the tax—you’re better off.
[1] Bloomberg Treasury Bond Index, 10/19/2023 through 12/19/2023
[2] Bloomberg Municipal Bond Index, 10/19/2023 through 12/19/2023
[3] Bloomberg as of 12/19/2023
[4] For illustrative purposes, we assume 0% state tax rate. U.S. Treasuries are typically exempt from state income tax, however investors should also consider their individual state income tax rate when making comparisons between taxable and tax-exempt securities.
[5] Bloomberg as of 2/16/2021