By: Aaron Wall, CFA
Partner, Portfolio Manager
As we talked about in the Q1 Market Outlook Webinar a few weeks ago, there are a number of themes we are monitoring to start off 2026. This week, we’re sharing an update on three of these key market fundamentals.
Q4 Earnings: Strong
The Q4 2025 earnings season is nearly over. With 74% of S&P 500 companies reporting (as of last Friday, February 13), the blended earnings growth rate currently sits at 13.2%. This would be the fifth consecutive quarter of double-digit earnings growth for the index.The Technology sector remains a key driver, but participation has become more widespread, with Industrials, Communications, and Financials becoming meaningful contributors.
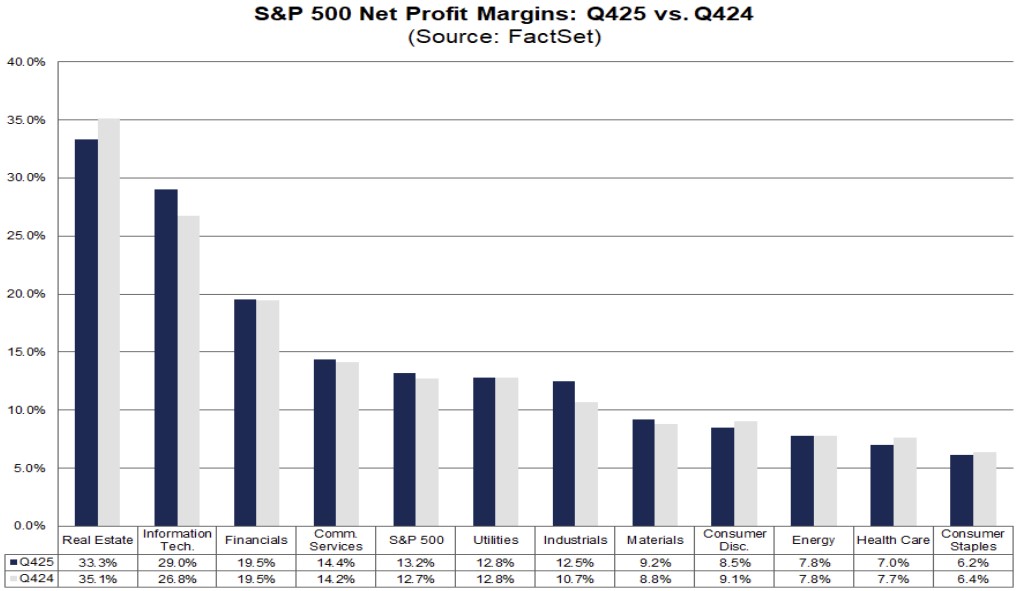
Another important metric to follow during earnings season is net profit margins. At the highest level, margins are driven by revenues and costs. Higher margins translate to a higher percentage of profit for each dollar of revenue that a firm generates.
The recent bout of inflation has put stress on the cost component of the equation, but strong demand trends and technological innovation appear to be combating this force.
As seen in the chart below, margins remain in a healthy position compared to 2024 levels. We interpret this as a positive for the condition of the overall market.
Equity Sector Performance in 2026: Rotational
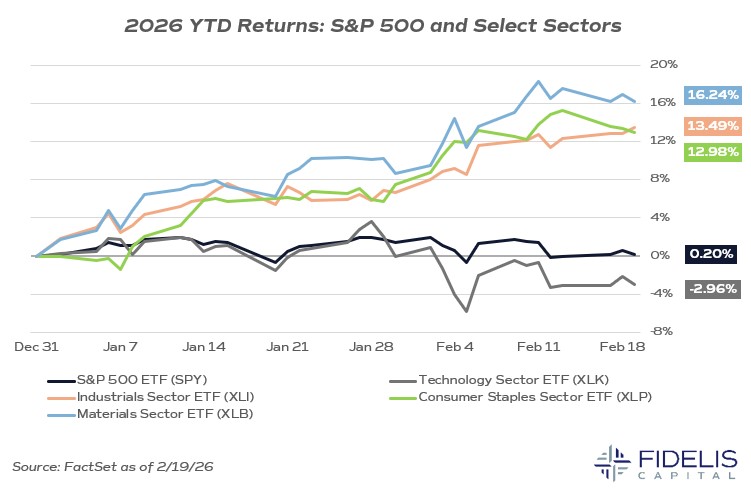
We’ve discussed over the last few weeks how the equal weight S&P 500 has been outperforming the traditional S&P 500 thus far in 2026. That theme remains intact.At the top of the following chart are the Materials, Industrials, and Consumer Staples sectors. These areas have been incredibly strong to start the year as investors have rotated out of Technology names (bottom line on the chart).
By looking at the S&P 500, we can see how the strength in the top three sectors has offset the decline in Technology. This is an important “flip” of the previous trend of Technology being on top, offsetting weaker performance in the rest of the economy.
Volatility: Lower than Perceived
Finally, let’s take a look at the Volatility Index (VIX) over the past year. As apparent in the chart below, the VIX exploded in April of last year as the market sold off in response to the Liberation Day tariff policy announcement. Since then, the VIX has been relatively tame, with a few spikes related to geopolitical events.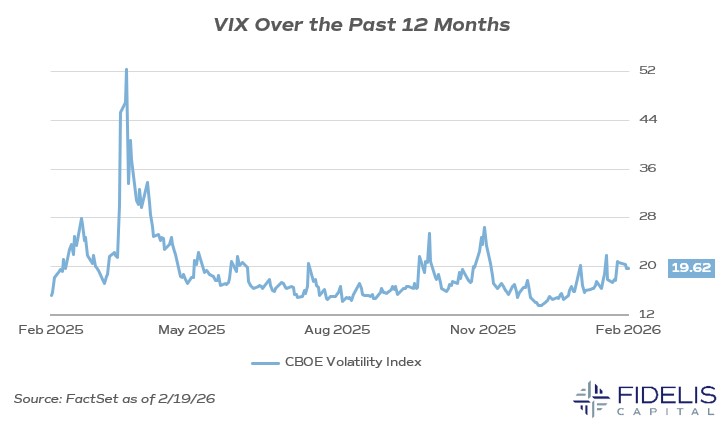
The VIX has moved up since the start of the year but has not broken out of its current range in a meaningful way. Paired with the fragmented market we’ve had so far in 2026, this feels inconsistent.
To many investors, it doesn’t feel like we are just barely negative YTD on the S&P 500. It doesn’t feel like volatility has been relatively contained so far this year. This has, however, been the reality. This is why we continue to emphasize that this environment looks rotational as investors adjust their portfolio allocations instead of indiscriminate selling that is common in deeper selloffs.
Geopolitical risks remain elevated, however, with the Supreme Court striking down most of Trump’s tariffs this morning, an increase in US military presence across the Middle East, and a new Fed chair on the way. These could all impact markets, but with strong earnings, a broadening rally, and well contained VIX, there may more be strength than we currently realize.