Partner, Head of Fixed Income
Update: June 28, 2024
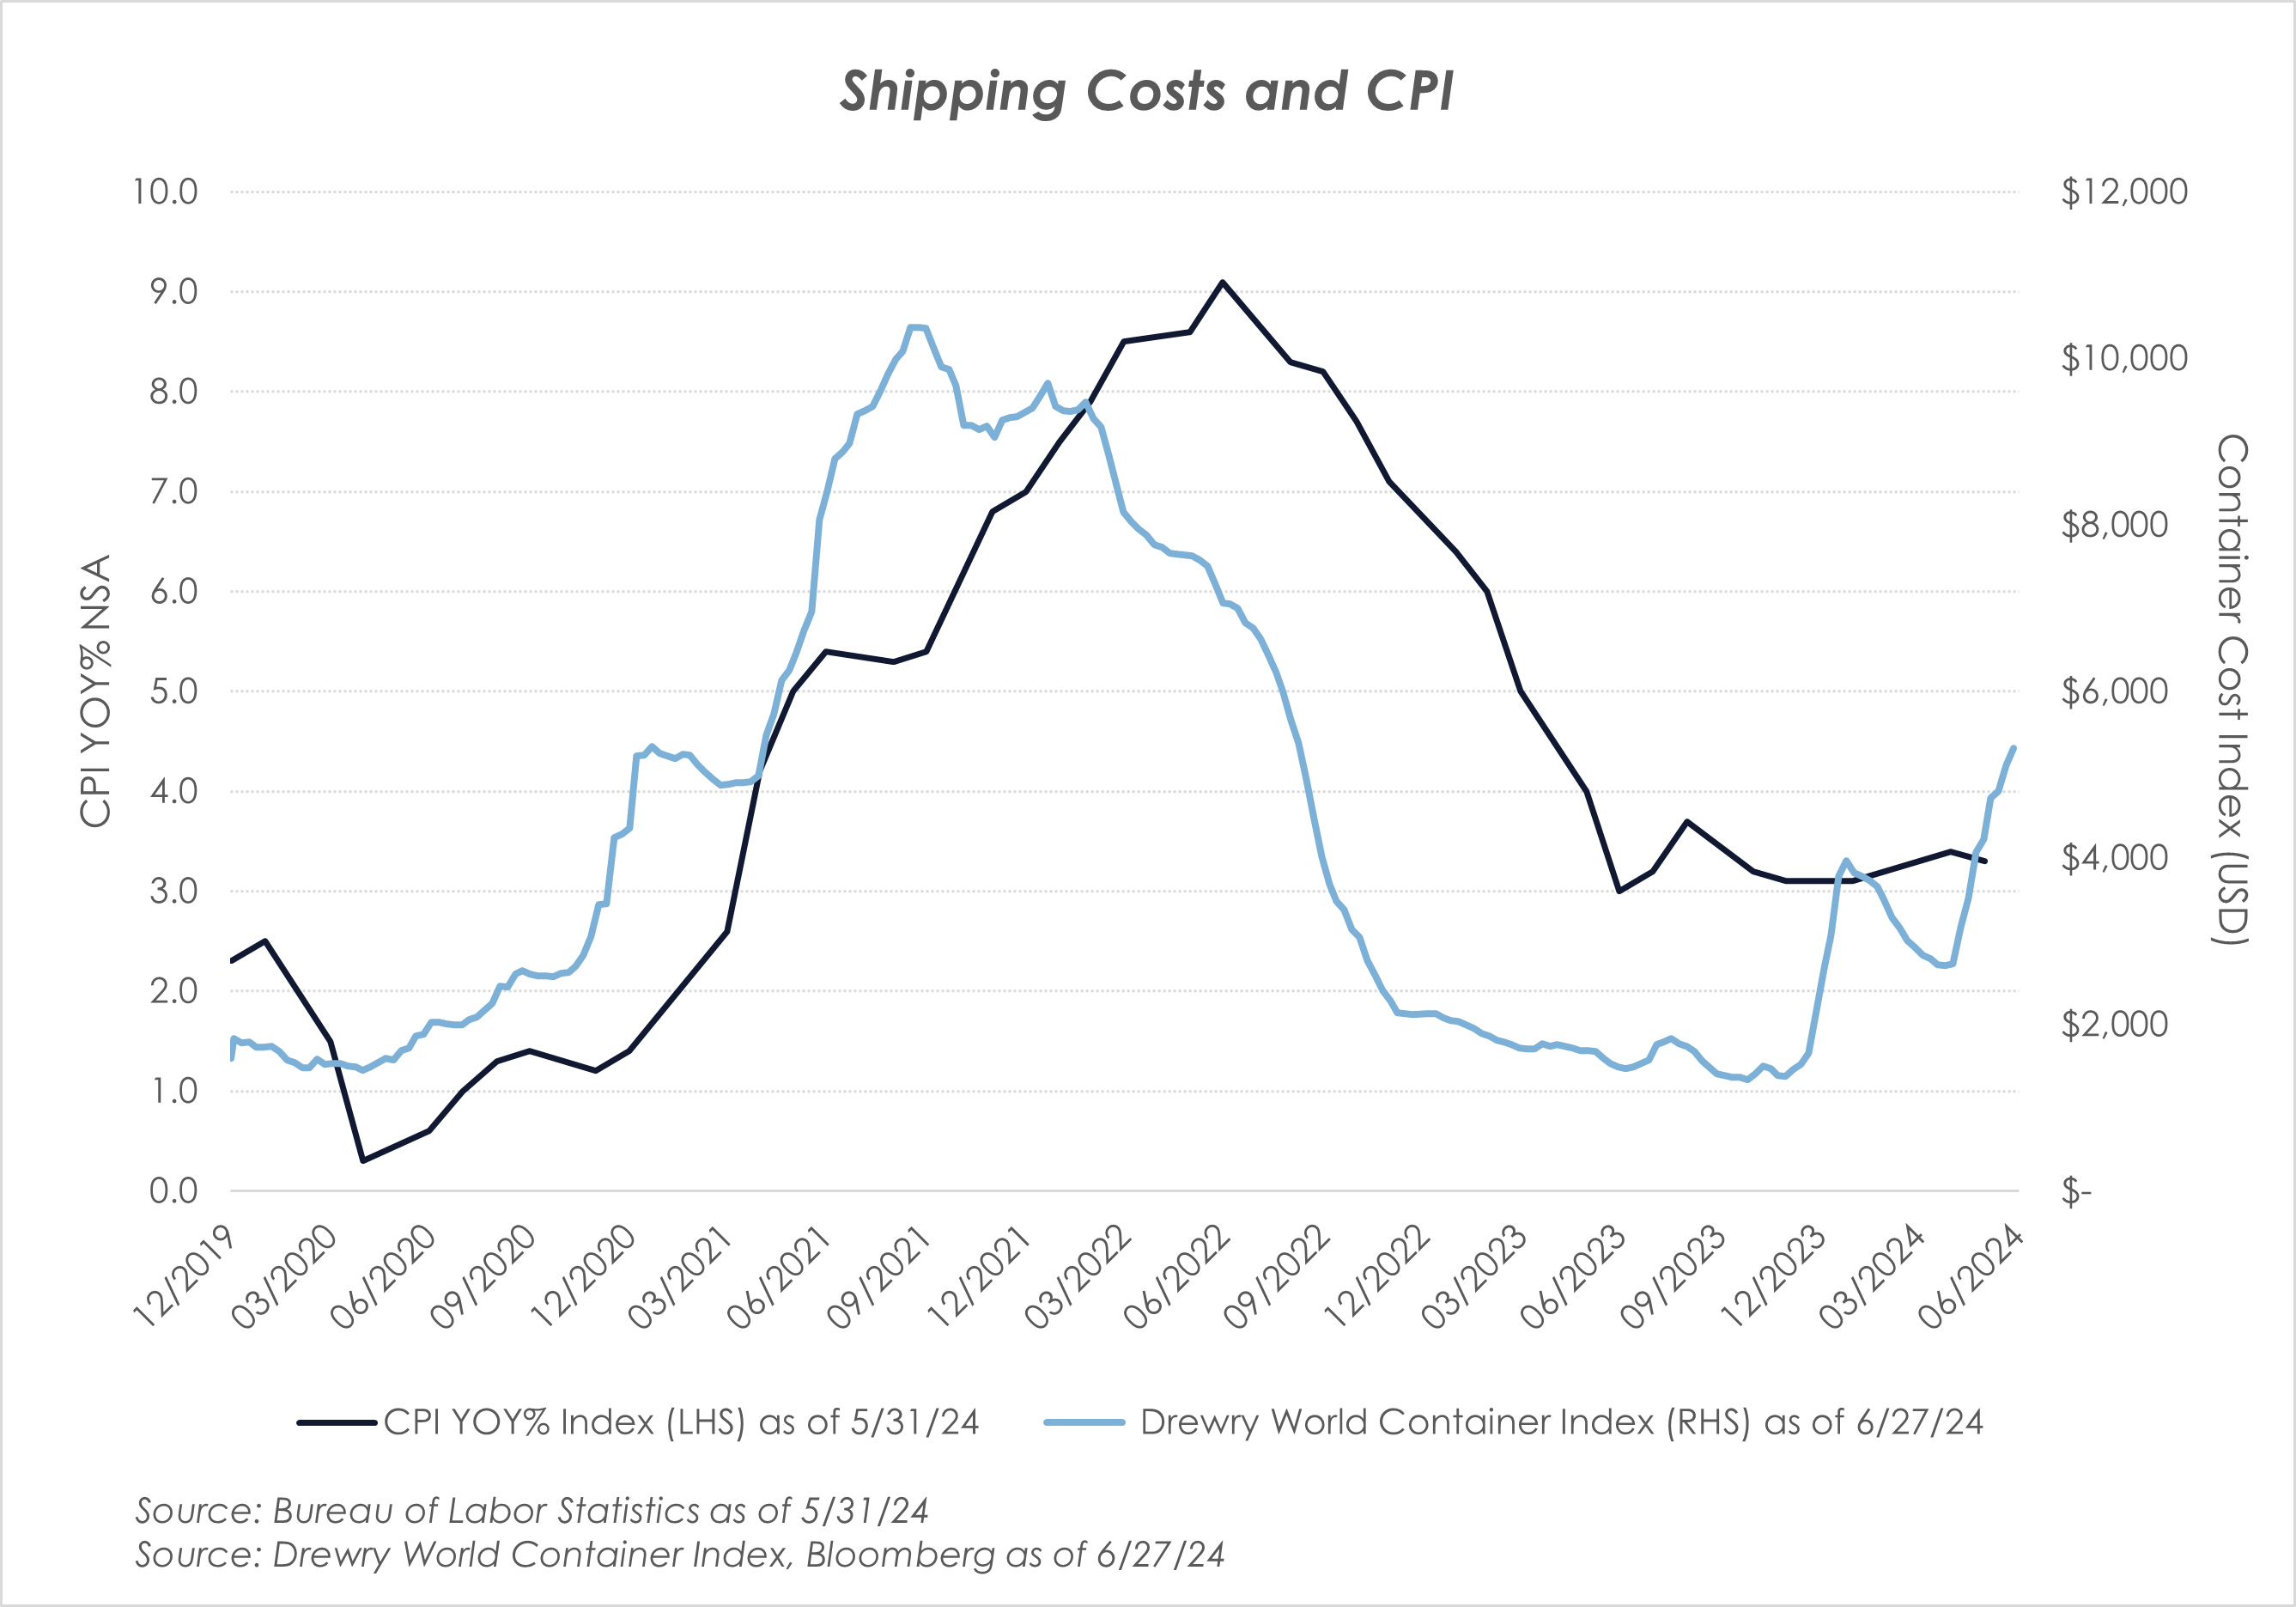
The most recent shipping costs data, released June 27, shows a further increase with no signs of slowing down. For the month of June alone, the Drewry World Container Index has risen from $4,226.49 to $5,318.38, a 26% increase.
Today’s release of the Core PCE Price Index YOY% showed a decline in inflation from 2.78% in April to 2.57% in May. That data should give the Fed the cover to cut rates in September, but the increase in shipping costs has us concerned that inflation in some parts of the economy could increase, or at least not decline to the extent that markets expect, as we move into the latter part of 2024. The chart below shows the relationship between shipping costs and CPI YOY%, which reflects that spot shipping costs tend to lead the CPI YOY% by roughly six months.
Update: June 13, 2024
The latest release of core PCE came in at 2.8% YOY, which was as expected but still higher than the Fed’s longer-term target of 2%. Wednesday’s release of the May CPI data came in a bit lower than expected at 3.3% YOY, but that too is higher than the Fed’s 2% desired rate. These releases did little to change the market’s expectation of a cut or two for the balance of the year. The question remains: Will inflation continue to ebb enough in the near future for the Fed to begin cutting rates sooner rather than later?
One of the economic data points that has us concerned about the Fed’s ability to curb inflation, and therefore cut rates in the near-term, is the recent surge in shipping costs.
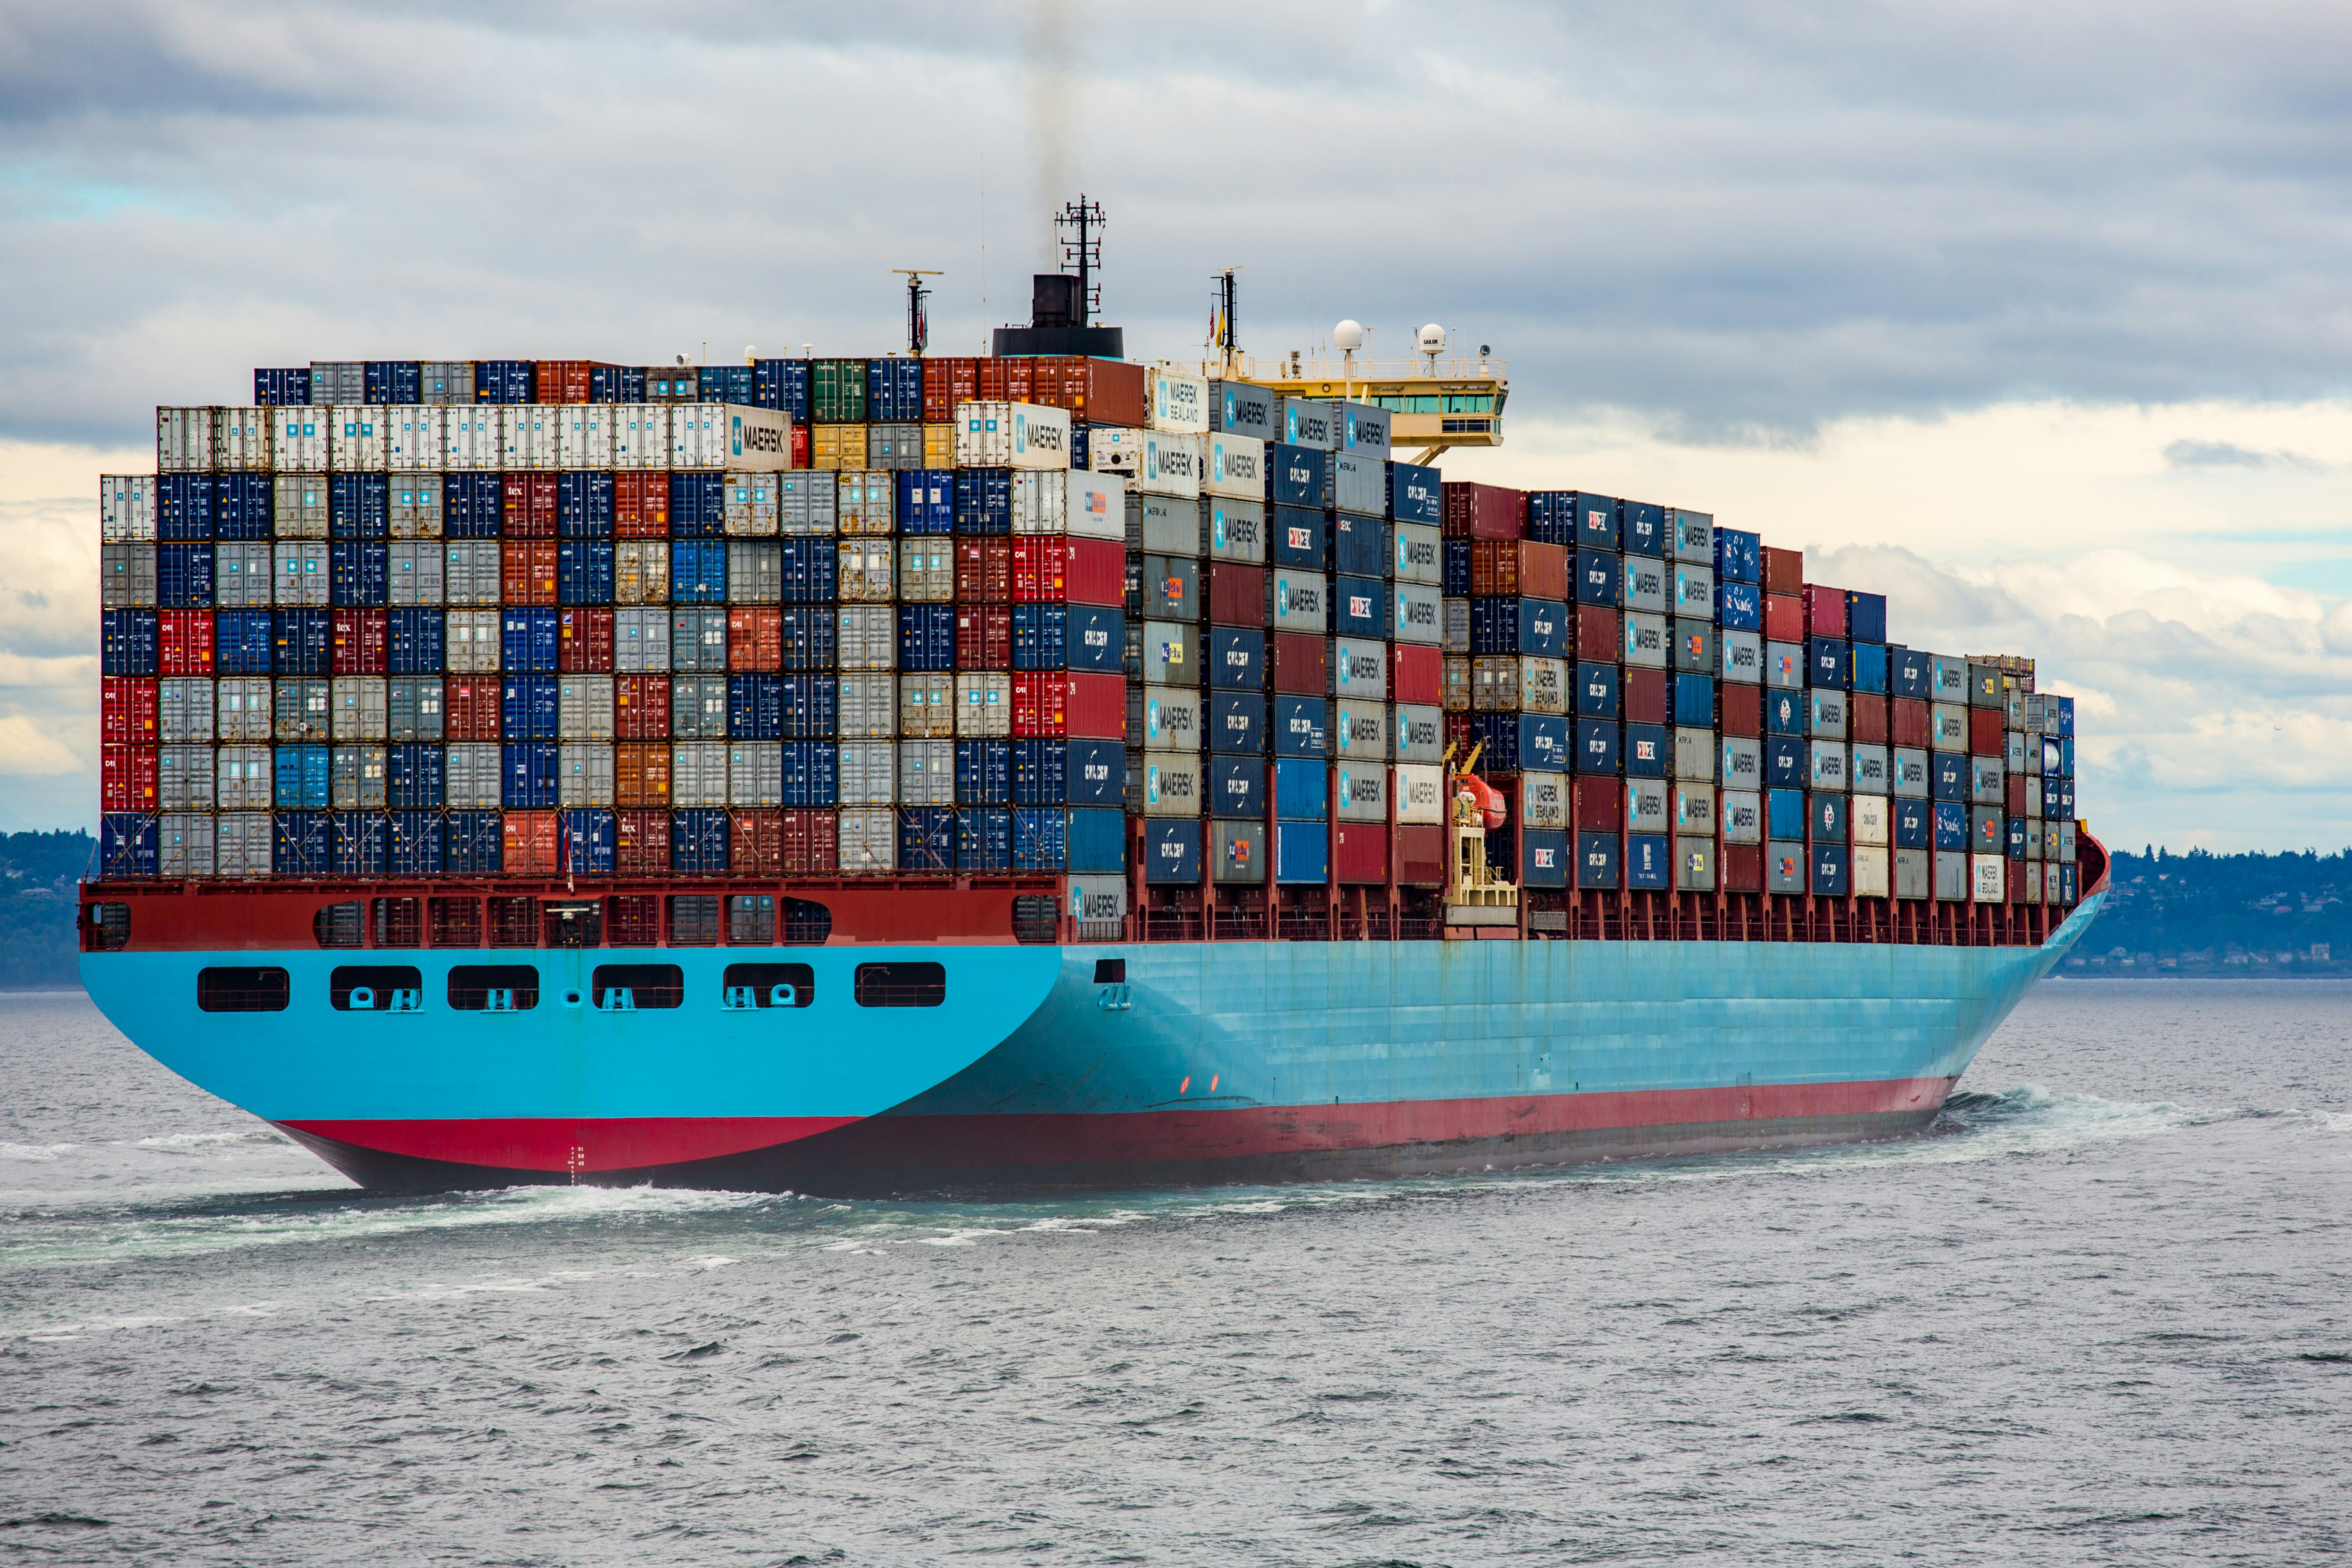
The Drewry World Container Index tracks the cost of a 40-foot shipping container for major global trade routes. As of today, the index showed a cost of $4,801 per container, up from $1,661 at the end of 2023—a 189% increase. Drivers of this recent spike include diversions around the Suez Canal and increased demand from shippers.
The chart above shows the relationship between shipping costs and CPI YOY%, which reflects that spot shipping costs tend to lead the CPI YOY% by roughly six months. Of course, this is not the only input causing inflation, but it is a variable worth watching, as the World Economic Forum estimates that 90% of the world’s goods are shipped by sea.
If the current increase in shipping costs translates to higher prices in the next few months, that could hamper the Fed’s ability to cut rates in 2024. Should shipping costs continue to increase above the current elevated level, then the Fed may be on hold for even longer.