By: Michael Sellers
Partner, Portfolio Manager
As we kicked off September this week, we also entered a historically tough seasonal stretch for markets. Should investors be worried? That’s the question we’re addressing in today’s edition.
September Seasonality
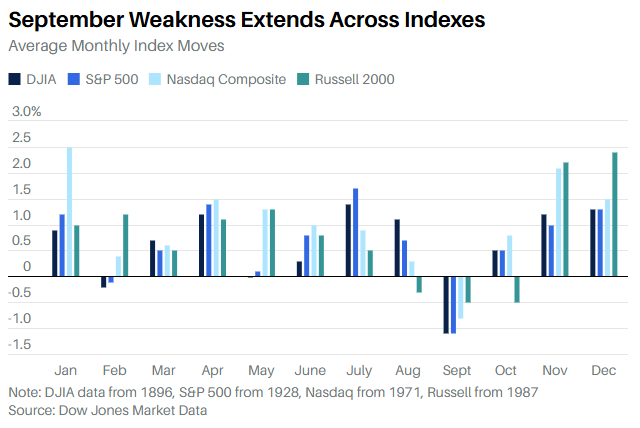
As legendary market strategist Ed Yardeni recently wrote, “Everyone in the stock market knows that September is the cruelest month for stocks.” And the data backs up his assertion.In the last five years, the S&P 500 has declined 2.7% on average in September, making it the worst month of the year for the market. Over the last 15 years, the pattern holds as well, with the market down more than 1.3% on average during the month.
According to data compiled by Dow Jones, since 1928 the S&P 500 has been negative about 55% of the time in September, its worst win/loss rate on the calendar.
September’s weakness in the S&P 500 also extends across the Dow, Nasdaq, and Russell 2000 (small-cap stocks), with each index having, on average, its worst monthly performance in September.
Source: Barron's
So Ed, it appears you are correct.
Adding to the market’s seasonal concern is the fact we are in the midst of a midterm election year. Midterm elections are also notoriously volatile, which typically causes lower expected returns and greater volatility compared to non-midterm years.
Volatility in midterm years is usually centered around two time periods, the early summer period of late May to early June, and then again in late August through September. Interestingly enough, in midterm years, markets tend to start turning higher into October with a continued rally through year-end, as depicted in the chart below.
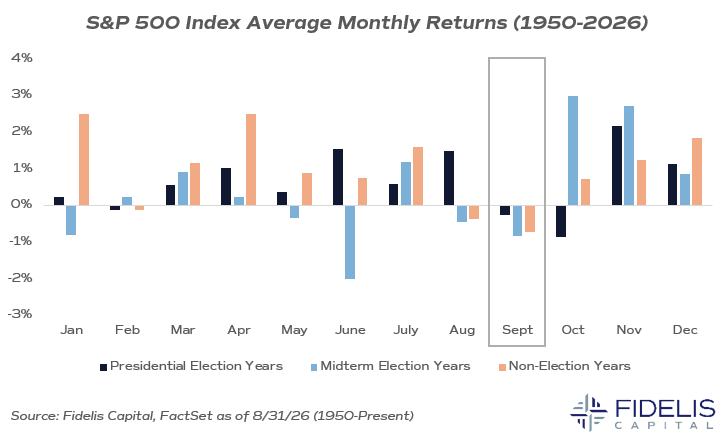
A study by BlackRock found that markets typically start trending positive about three weeks before a midterm election as expectations become more clear.
What Does This Mean For Investors?
One, understanding what to expect gives investors better context during these inevitable periods of volatility. As noted, there are numerous studies and decades of market data that show September is typically the weakest month on the calendar in any given year.Every market algorithm, momentum trading platform, and quantitative model trading system is aware of this fact. This is not a secret to investors.
What that means is that markets can be even more sensitive to shorter-term headline risk, as sentiment can be prejudiced to the downside. Trades can become more crowded, and volatility can be heightened.
Two, we need to remind ourselves that markets are inherently volatile, midterm years even more so. In fact, the last two down years for the S&P 500 coincided with the last two midterm election cycles.
In 2018, the S&P 500 was down 4.3%, and in 2022, it declined 18.1%. But the next 12 months? Markets rebounded. In 2019, the S&P 500 was up 31.5%, and in 2023, it was up 26.3%.
Final Thoughts
Seasonal weakness and midterm uncertainty, combined with elevated headline risk, have the potential to make the next several weeks feel chaotic, though this is hardly unexpected.We caution our clients that successful investing is not about avoiding uncertainty. It’s about being prudent and patient, being able to distinguish signals from the inevitable noise, and, most importantly, keeping a long-term perspective aligned with your portfolio’s goals and objectives.