By: Aaron Wall, CFA
Partner, Portfolio Manager
Fixed income has been in the spotlight this week as the 10-year US Treasury yield broke through the symbolic threshold of 5%.
Let’s analyze a few charts to better understand how this is impacting fixed-income markets in real time and how we view this move in the context of our portfolio management process.
The Size of the Treasury Market
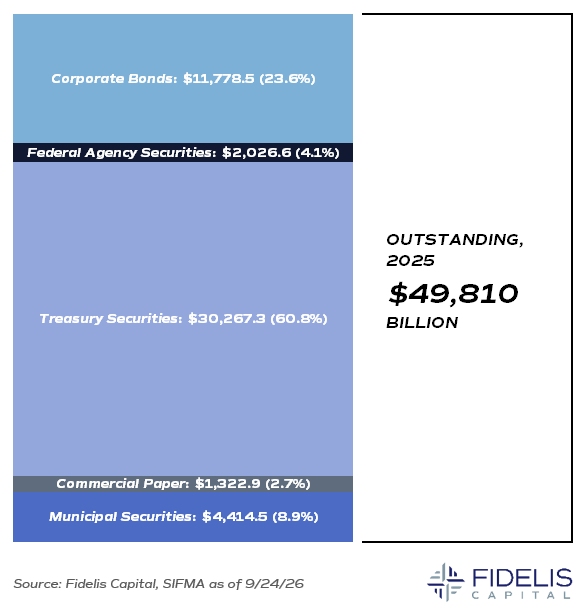
The 10-year Treasury yield is one of the most closely watched financial indicators because the US Treasury market is the largest security market in the world.As of early September, the Treasury market consisted of $31.8 trillion of outstanding debt. The chart below, from the Securities Industry and Financial Markets Association (SIFMA) measures the outstanding balance of all debt in the United States as of the end of 2025.
As you can see, the bulk of the debt (over 50%) comes from US Treasury securities.
Source: SIFMA
The 5% Threshold
The chart below shows the 10-year yield going all the way back to 2000. The 5% threshold has not been breached consistently since early 2007, meaning the yield has broken a nearly 20-year streak.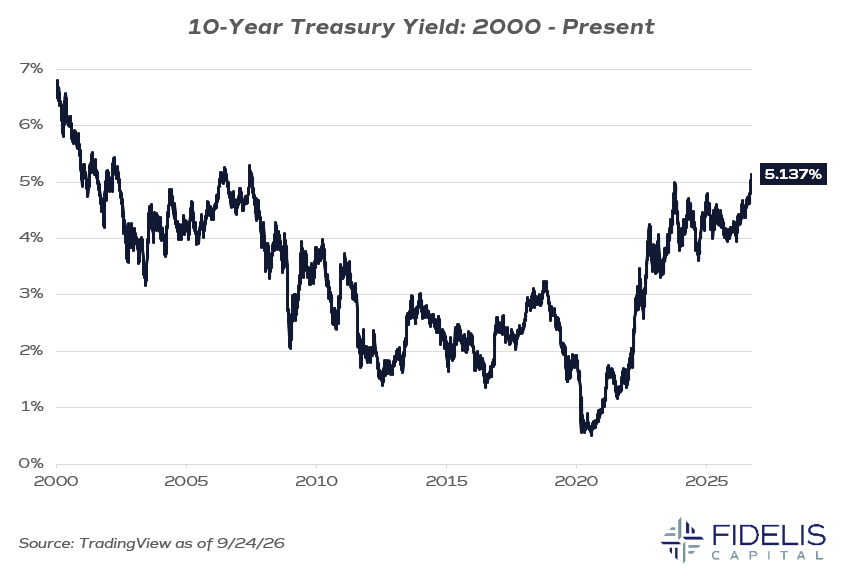
This 20-year span is notable because of the quantitative easing (QE) operations conducted by the Federal Reserve. QE was the initial monetary response to the 2008 financial crisis, and the playbook was dusted off again in the wake of the COVID-19 pandemic in 2020.
Seeing the yield over 5% creates discomfort, but on a historical basis, this is part of the process of returning to a more normal interest rate environment.
It’s also important to note the 10-year yield’s significant increase in 2023, when inflation was rampant and the Fed had to aggressively raise interest rates in response. Since then, the yield has traded between 4% and 5% with relative consistency until now.
Corporate Bond Spreads
Spreads are a quick way to measure the market’s view on general increases in risk. Corporate bonds should always trade at a premium to a comparable Treasury bond, so the additional premium is an implied view on the riskiness of that corporate bond.A higher yield indicates that the market needs more compensation to take on the risk of that bond. The chart below plots a widely followed index of corporate spreads.
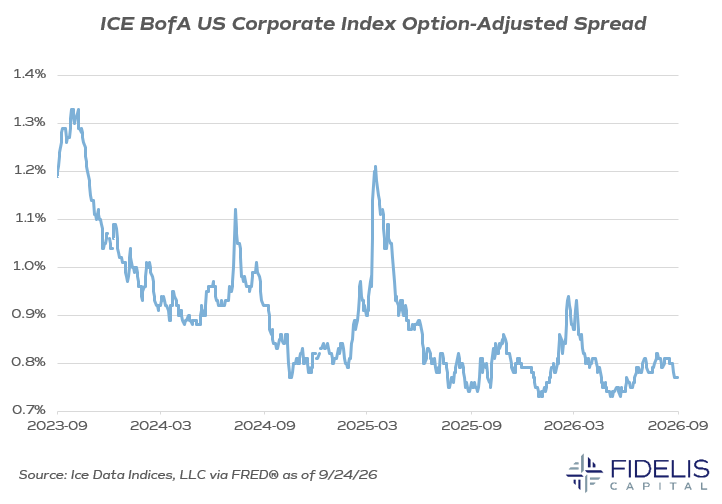
As you can see, even with the recent volatility in Treasuries, spread levels are staying well contained. This can be interpreted as the market not assigning a higher risk of default to credits across the index.
The two recent spikes in spreads were in April of 2025 (Liberation Day) and February/March of 2026 (beginning of the Iran War). We’d expect to see these spreads increase dramatically if there was a major risk-off sentiment in the market, but for now, it is remaining relatively contained.
2-Year Yield
When looking at the yield curve, it is widely accepted that yields on the shorter end of the curve (shorter maturities) trade heavily with investor expectations of Federal Reserve policy.The longer end of the curve tends to represent investor long-term growth and inflation expectations. The 2-year US Treasury yield has experienced a volatile month, nearing 5% as of Thursday.
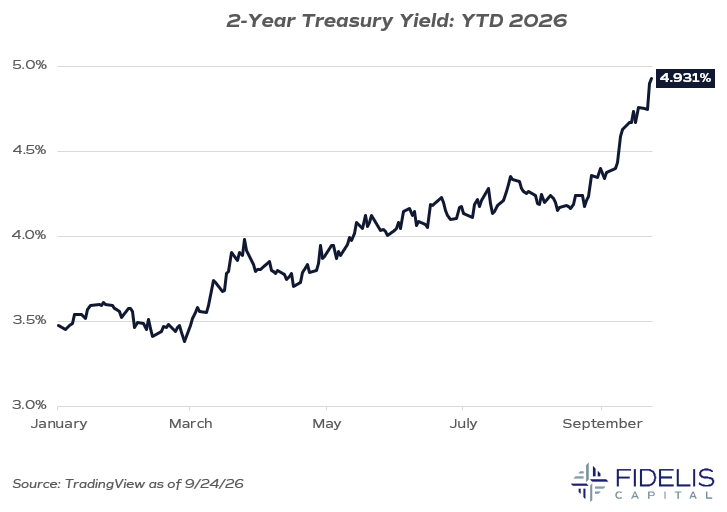
The above chart plots the 2-year yield so far in 2026. As you can see, it started rising right after the war began and oil prices started to move higher.
Coming into 2026, investors were expecting the Fed to be cutting interest rates at some point in the year. After energy prices skyrocketed, investor expectations started to price in tighter monetary policy from the Fed, culminating in the first interest rate hike, which we saw last week.
As the 2-year rises, it signals that investors are preparing for a cycle of interest rate hikes from the Fed. Since the beginning of this week, investors have started assigning odds of an increase at the next two Fed meetings (October and December) followed by two more meetings in 2027.
The market has not had a good track record of predicting the Fed’s long-term moves lately, but this change in expectations helps explain the weaker market we’ve experienced so far this week.
The Bottom Line
How does all of this information impact our view on bonds? Our fixed-income guru (the FIG) Chris Gunster says:Now is the time to be active. We actively manage fixed income, and this volatility breeds significant opportunity for tax-loss harvesting. We are harvesting losses in bond portfolios right now, and the opportunity to realize a tax loss and invest in a higher-coupon bond can be meaningful over time.
Presently, this is not a credit event. Spread levels are remaining contained. We will continue to watch them, but right now, this doesn’t seem to be driven by a larger risk-off sentiment. That being said, we have been focused on higher-quality credits in portfolios and that should continue.
Watch institutions. With the quarter coming to an end, expect large institutions like pensions and insurance companies to be buyers at these levels. Also keep in mind that there is still $8 trillion in money market funds looking for higher yields.
For more fixed-income insights after the Fed rate hike and recent bond market moves, check out Gunster’s latest LinkedIn post. He recaps where to park cash, the current opportunity in municipal markets, and what investors in no income tax states should be doing.